Author Topic: zTrace version 3.00  (Read 17181 times)

Patrice Terrier

  • Administrator
  • *****
  • Posts: 1980
    • zapsolution
zTrace version 3.00
« on: April 18, 2017, 08:00:57 pm »
zTrace 3.00 (for 64-bit only)

This Visual Studio 2017 community project, has been totaly reworked to reduce the size down from 91 to 14 Kb.
(with the same technic used to produce the tiny MBox64 OpenGL visual plugins.)

zTrace is a small DLL utility to display debugging information into a popup window tool, and/or a text file.
It uses a distinct thread to work in parallel of the current application you want to debug.

zTrace is very useful at development time to check whether a program operates properly.
It has been modeled onto the WinDev's Trace API, the original Win32 version was written in PowerBASIC.

I first wrote zTrace to debug my addon graphic DLL tools, but it works also very well with any 32-bit or 64-bit EXE.
When i took the decision to convert WinLIFT and GDImage to C++, it was the first on my list, because I couldn't develop anymore without it.

zTrace uses exclusively the core flat API, that is the only common denominator to all the languages I use, and the only way to get rid of extra dependencies.
The source code is provided in pure SDK coding style like documented into Charles Petzold 5th edition (the SDK coder Bible).

zTrace 64-bit is UNICODE based (32-bit is ANSI).

Syntax to use:
zTrace(L"Wide String Information")

Parameter detail:
one single unicode (WCHAR) string, holding the information to display in the trace window.

Trace window:
• The information passed as parameter is displayed on the next line of the zTrace window.
• The trace window is automatically opened when zTrace is called, by default, this window is opened at the top left corner of the screen.
• The zTrace window shuts down automatically when you close the application being debugged.

zDebug.txt report:
• Works exactly like the zTrace window, except that the information is written to a text file.
• The report is automatically created when zDebug is called, it is saved into the same folder than the debugged application.
• zDebug can be used alone or combined with zTrace (when the option is checked in the popup menu).
• zDebug is very handy when the debugged application shuts down unexpectedly or when the application as a short life duration, that won't give you enough time to read what is written in the zTrace window.
• A new fresh zDebug.txt is created each time you start a new zDebug session.

Contextual popup menu (right mouse click on the trace window):
• "Use horizontal scrollbar", show or hide the horizontal scrollbar.
• "Send selection to printer", print the selected lines (or the whole list when none).
• "Copy selection to clipboard", copy the selected lines (or the whole list when none) to clipboard.
• "Clear content", clear the content of the Trace window.
• "Trace window TopMost", open the Trace window on top of all the other windows (including the windows from the other applications).
• "Create zDebug.txt report", the zDebug.txt report is created into the debugged application's folder.
• "Save window coordinates", store the size and position of the zTrace window for the next session.

Screen shot:


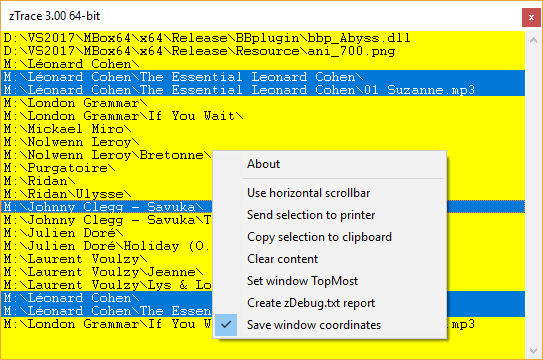
Helper function, for EXPLICIT linking:
Code: [Select]
#define long_proc typedef long (__stdcall *zProc)

long zTrace(IN WCHAR* sPtr) {
    long nRet = 0;
    static HMODULE hDll;
    if (hDll == 0) {
        if (sizeof(LONG_PTR) == 8) {
            hDll = LoadLibrary(L"zTrace64");;
        }
        else {
            hDll = LoadLibrary(L"zTrace32");
        }
    }
    if (hDll) {
        long_proc(WCHAR*);
        static zProc hProc;
        if (hProc == 0) { hProc = (zProc)GetProcAddress(hDll, "zTrace"); }
        if (hProc) { nRet = hProc(sPtr); }
    }
    return nRet;
}

I want to say thank you to Fred and James for letting me know how to reduce drastically the size of a 64-bit application.


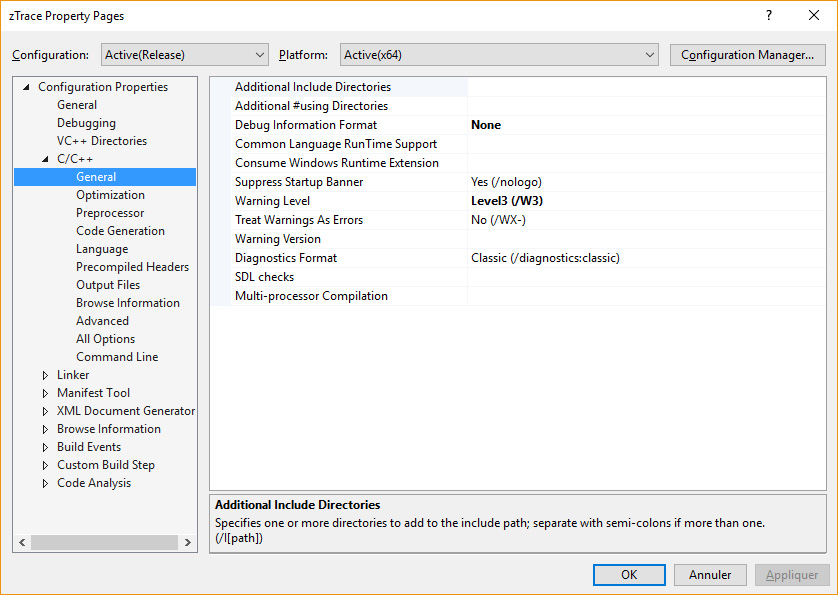
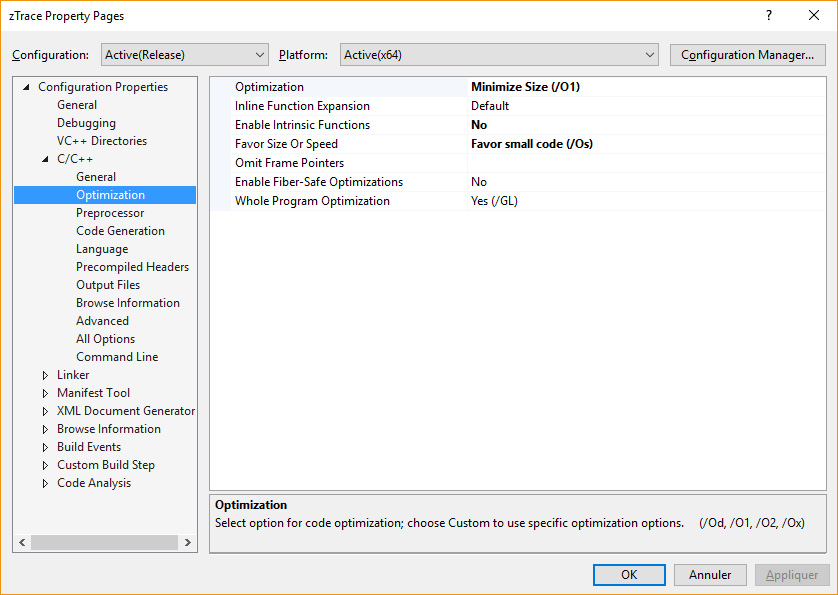
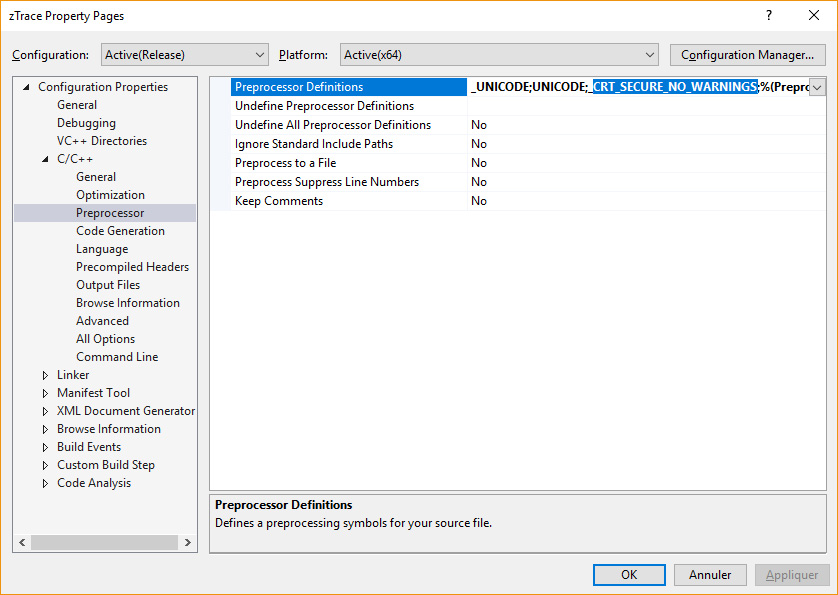
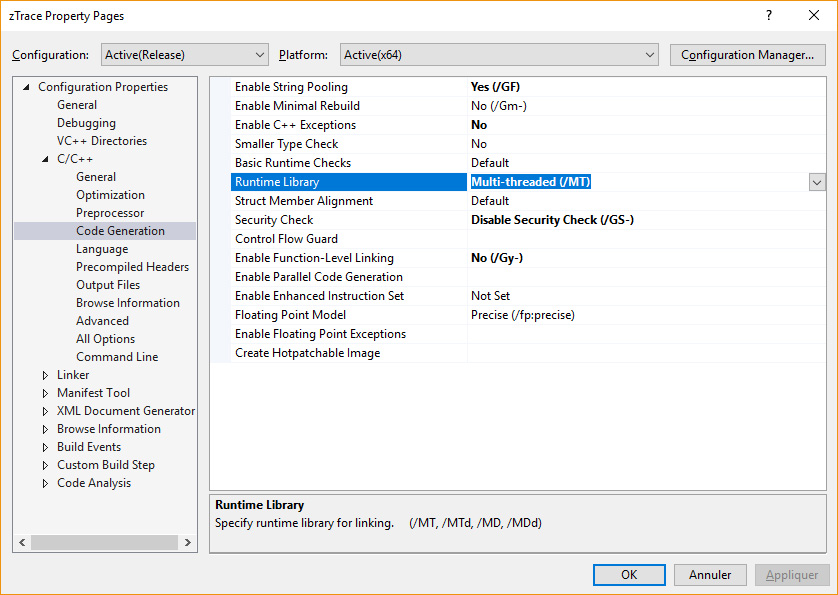
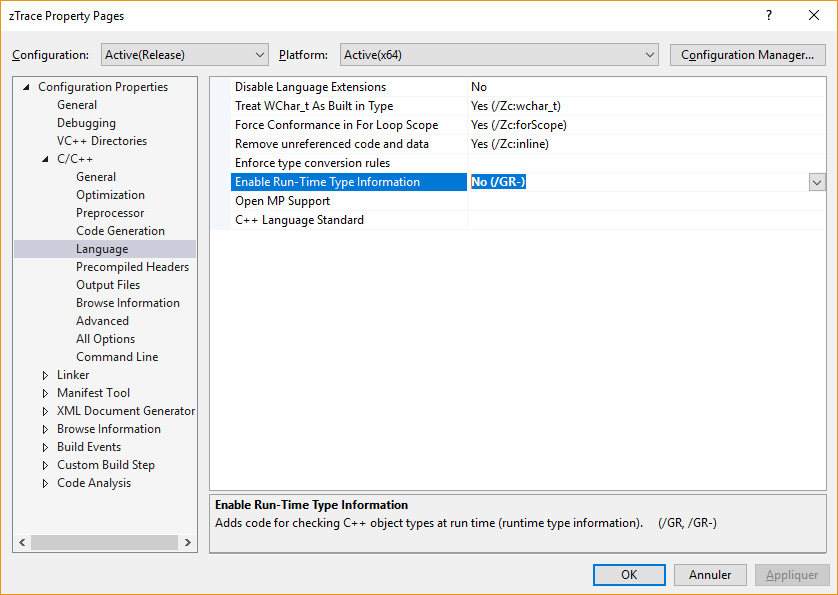
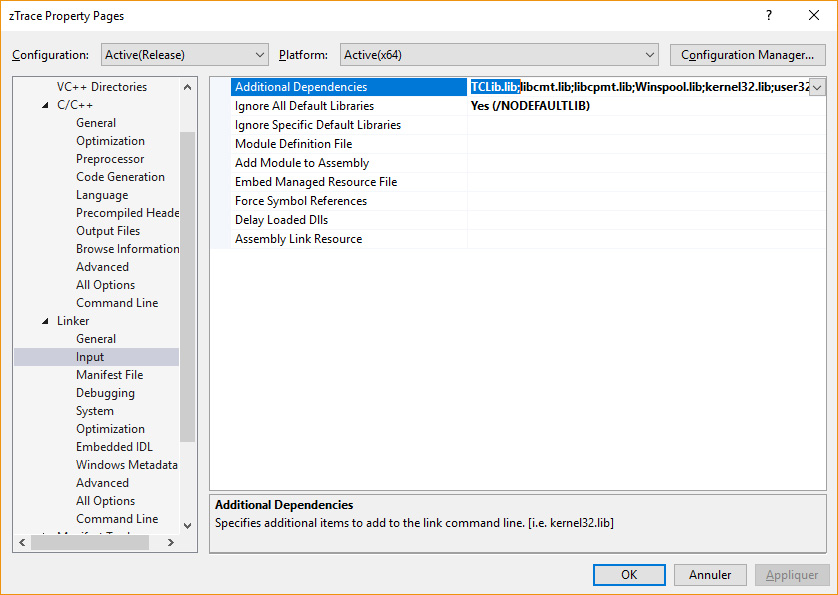
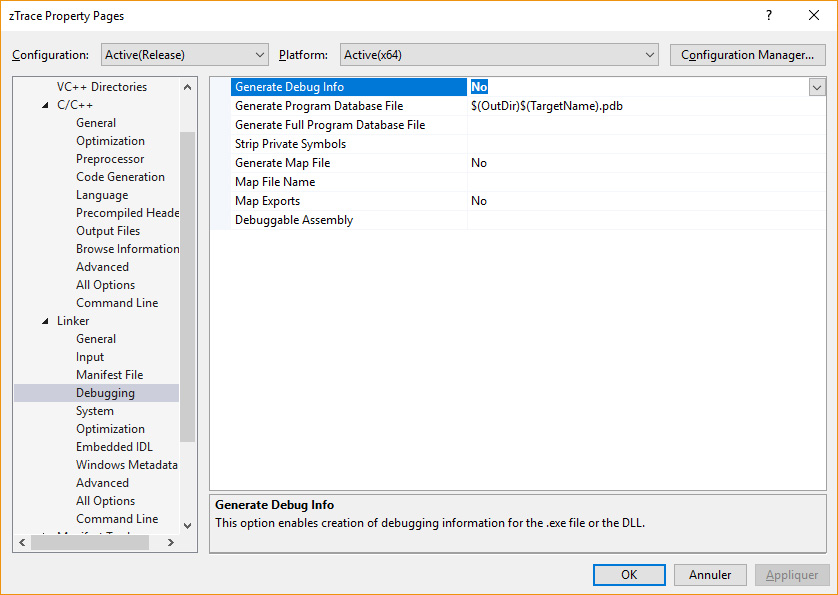
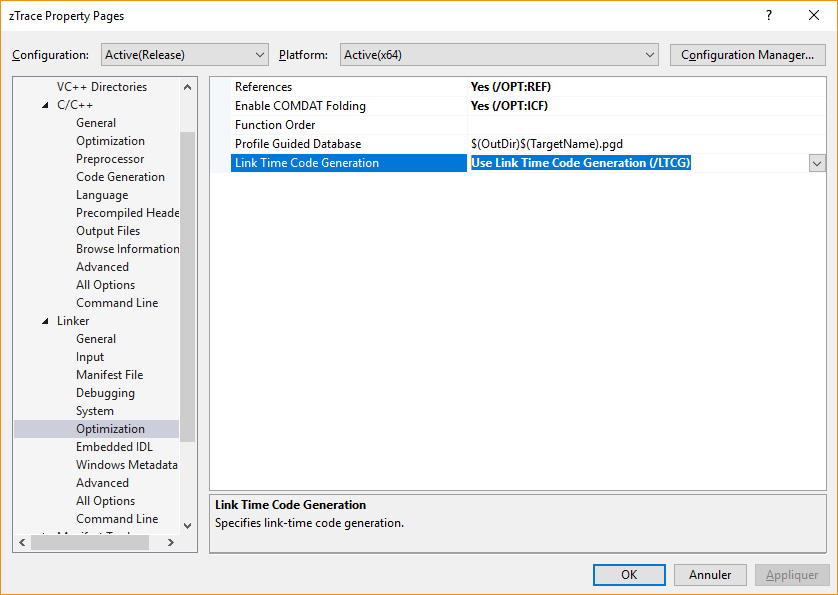
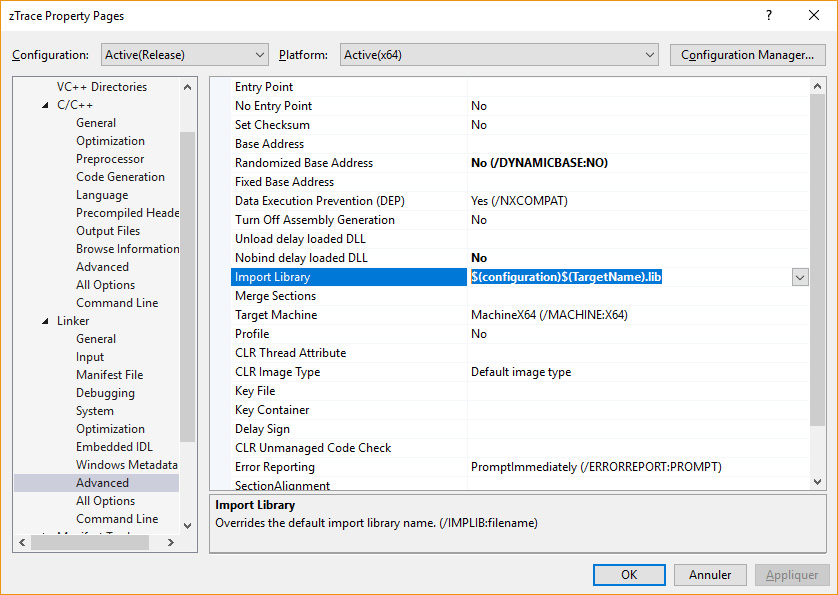
Settings used to create this tiny 14 Kb 64-bit DLL

zTrace Property Pages
The calling Convention for 64-bit is always using __fastcall (/Gr).
And in 64-bit no need to use a .def file to avoid the decorated names.


Include + Pragma
Code: [Select]
#include <windows.h>
#include "..\TCLib\Strings.cpp"

#pragma warning(disable: 4996) // remove Unsafe notifications
#pragma warning(disable: 4312) // remove warning C4312: 'type cast': conversion from 'long' to 'HMENU' of greater size

History
See it here: http://www.jose.it-berater.org/smfforum/index.php?topic=3092.0

04-26-2017
Fix:
delete [] SelItem;
was unexpectedly missing from the case IDM_Print

Enhancement:
New menu option: "Use Unicode in zDebug.txt"
to switch between ANSI or UNICODE
in case of ANSI, a UTF-8 BOM header is now being used.
UTF-8 BOM is a sequence of bytes (EF BB BF) that allows the reader to identify a file as being encoded in UTF-8.

04-27-2017
I have merged Andrei changes into this new version, with:
further code clean up,
new font set for both the listbox window and the printer,
switched back to XP compatibility,
no more TCLib linking that has been removed.

With more features, and further code optimization, the resulting size of the 64-bit Unicode DLL, is now only 11 Kb.
« Last Edit: February 20, 2022, 02:59:16 pm by Patrice Terrier »
Patrice
(Always working with the latest Windows version available...)

Patrice Terrier

  • Administrator
  • *****
  • Posts: 1980
    • zapsolution
Re: zTrace version 3.00
« Reply #1 on: April 26, 2017, 09:58:41 am »
from Andrey Unis

By the way with only 14Kb, it could be used to debug any unicode 64-bit application...
Can make 11kb...
By the way, there are few mistakes...
function zDebug() includes NUL characters to log file
WideCharToMultiByte(CP_ACP, 0, sMessage, -1, buffer, BufferSize - 1, 0, 0);
(but better remake this function to support unicode chars (for example chinese language))

function ToolProc()
Code: [Select]
    case WM_GETMINMAXINFO:
         MoveMemory(&pMM, (MINMAXINFO*) lParam, sizeof(pMM));
         SetRect(&rc, 0, 0, MIN_WIDTH, MIN_HEIGHT);
         AdjustWindowRectEx(&rc, dwStyle, FALSE, dwExStyle);  // Adjust Window To True Requested Size
         pMM.ptMinTrackSize.x = rc.right;
         pMM.ptMinTrackSize.y = rc.bottom;
         break;
fix
Code: [Select]
case WM_GETMINMAXINFO:
SetRect(&rc, 0, 0, MIN_WIDTH, MIN_HEIGHT);
AdjustWindowRectEx(&rc, WND_Style, FALSE, WND_ExStyle);  // Adjust Window To True Requested Size
((LPMINMAXINFO)lParam)->ptMinTrackSize.x = rc.right;
((LPMINMAXINFO)lParam)->ptMinTrackSize.y = rc.bottom;
break;

case IDM_Print:
  ...
  long* SelItem = new long[nSelItems];
memory leak, missed: delete [] SelItem ;

my variant (11kb) attached
« Last Edit: April 26, 2017, 10:03:18 am by Patrice Terrier »
Patrice
(Always working with the latest Windows version available...)

Patrice Terrier

  • Administrator
  • *****
  • Posts: 1980
    • zapsolution
Re: zTrace version 3.00
« Reply #2 on: April 26, 2017, 04:28:22 pm »
The first post of this thread has been updated with a new version.

Fix:
delete [] SelItem;
was unexpectedly missing from the case IDM_Print

Enhancement:
New menu option: "Use Unicode in zDebug.txt"
to switch between ANSI or UNICODE
in case of ANSI, a UTF-8 BOM header is now being used.
UTF-8 BOM is a sequence of bytes (EF BB BF) that allows the reader to identify a file as being encoded in UTF-8.

Thanks to Andrey Unis who reported these to me.
Patrice
(Always working with the latest Windows version available...)

Patrice Terrier

  • Administrator
  • *****
  • Posts: 1980
    • zapsolution
Re: zTrace version 3.00
« Reply #3 on: April 27, 2017, 06:56:32 pm »
The first post of this thread has been updated with a new version.

I have merged Andrei changes into this new version, with:
further code clean up,
new font set for both the listbox window and the printer,
switched back to XP compatibility,
no more TCLib linking that has been removed.

With more features, and further code optimization, the resulting size of the 64-bit Unicode DLL, is now only 11 Kb.
Patrice
(Always working with the latest Windows version available...)

Emil Weiss

  • Guest
Re: zTrace version 3.00
« Reply #4 on: May 04, 2017, 03:07:04 am »
..
« Last Edit: January 07, 2018, 12:26:06 pm by Emil Weiss »

Patrice Terrier

  • Administrator
  • *****
  • Posts: 1980
    • zapsolution
Re: zTrace version 3.00
« Reply #5 on: May 05, 2017, 10:15:37 am »
Emil

In PB
DECLARE FUNCTION zTrace LIB "zTrace32.DLL" ALIAS "zTrace" (zMessage AS ASCIIZ) AS LONG
is to be used for IMPLICIT linking, not explicit.

If you want to use EXPLICIT linking with PB, you have to do this:
(assuming that the DLL is in the current path or within the same folder than the EXE).
Code: [Select]
funtion zTrace(zMessage as asciiz) as long
    long nRet
    static hDll, hProc as dword
    if (hDll = 0) then
        hDll = LoadLibrary("zTrace")
    end if
    if (hDll) {
        if (hProc = 0) then hProc = GetProcAddress(hDll, "zTrace")
        if (hProc) then
            call dword hProc USING zTrace(zMessage) to nRet
        end if
    end if
    function = nRet
end function

And the window shows up only when you use zTrace with an ANSI asciiz that is not NULL.

For example in your code you can do this
Code: [Select]
local rNumber as single
rNumber = 12.45!
zTrace("We have been there")
zTrace("And the value of rNumber =" + str$(rNumber))

And with PB10 like with C++, the zTrace code is compiled into your resulting code, only when you use it (compiler optimization).

« Last Edit: May 05, 2017, 11:39:50 am by Patrice Terrier »
Patrice
(Always working with the latest Windows version available...)

James Fuller

  • Newbie
  • *
  • Posts: 41
Re: zTrace version 3.00
« Reply #6 on: September 07, 2020, 01:16:41 pm »
Patrice,
  How can you have Debug.txt active when there is no place in the code you are debugging to pause so you can click the ztrace window?

James

Patrice Terrier

  • Administrator
  • *****
  • Posts: 1980
    • zapsolution
Re: zTrace version 3.00
« Reply #7 on: September 08, 2020, 03:32:40 pm »
James

Did you try to save the zTrace parameters, with zDebug enabled?
Patrice
(Always working with the latest Windows version available...)

James Fuller

  • Newbie
  • *
  • Posts: 41
Re: zTrace version 3.00
« Reply #8 on: September 08, 2020, 04:26:05 pm »
Patrice,
  I don't understand.
The only save I see when I right click the ztrace window is "Save Window cooridinates" which I do not know what that does?

It always pops up at the top left. (note I am running dual minitors)

I was hoping there was some way to have Debug.txt persistent across runs.

You speak of using zDebug at the top instead/with ztrace????
What is zDebug?

James

Patrice Terrier

  • Administrator
  • *****
  • Posts: 1980
    • zapsolution
Re: zTrace version 3.00
« Reply #9 on: September 08, 2020, 08:59:05 pm »
James

Use zTrace64  (version 3.01) with any application, then check the menu option "Create zDebug.txt report".

And the next time you use zTrace64, the zDebug.txt report will be created with any application using zTrace, until you uncheck it from the contextual menu.
Patrice
(Always working with the latest Windows version available...)

James Fuller

  • Newbie
  • *
  • Posts: 41
Re: zTrace version 3.00
« Reply #10 on: September 08, 2020, 10:26:15 pm »
James

Use zTrace64  (version 3.01) with any application, then check the menu option "Create zDebug.txt report".

And the next time you use zTrace64, the zDebug.txt report will be created with any application using zTrace, until you uncheck it from the contextual menu.

Patrice,
  I am not finding that the case.
I have to right click every time I use it. It is not persistent.
I am using the download form this forum which is 3.00 64 not 3.01

James

James Fuller

  • Newbie
  • *
  • Posts: 41
Re: zTrace version 3.00
« Reply #11 on: September 08, 2020, 10:41:42 pm »
Patrice,
  The old zTrace32 2.02 I have works correctly.
I tracked down on old 2.02 64 bit and it works also.
James
« Last Edit: September 08, 2020, 10:51:38 pm by James Fuller »

Patrice Terrier

  • Administrator
  • *****
  • Posts: 1980
    • zapsolution
zTrace64 version 3.01
« Reply #12 on: September 09, 2020, 10:31:11 am »
James

Here is the complete C++ VS2017 project to version 3.01.

That one works well by me.

Patrice
(Always working with the latest Windows version available...)

James Fuller

  • Newbie
  • *
  • Posts: 41
Re: zTrace version 3.00
« Reply #13 on: September 09, 2020, 12:41:03 pm »
Patrice,
  I think I found the issue. Your zTrace3.cfg file is never created.

This is my temp folder as returned from GetTempPath()

C:\Users\jcful\AppData\Local\Temp

From your source
Code: [Select]
    WCHAR zPath[MAX_PATH]; __stosb((LPBYTE)&zPath, 0, MAX_PATH * 2);
    GetTempPath(MAX_PATH - 12, zPath); lstrcat(zPath, L"zTrace3.cfg");

You do not add  a "\" before the name.


I was not able to compile the project with VS 2019. There were hard coded paths that VS whined about.

Why zTrace64 works for you ???


James

Patrice Terrier

  • Administrator
  • *****
  • Posts: 1980
    • zapsolution
Re: zTrace version 3.00
« Reply #14 on: September 09, 2020, 03:02:56 pm »
By me, GetTempath always return the path with a trailing back slash

even (from my Windows config) when SET is defined only like this:
TEMP=C:\Tmp
TMP=C:\Tmp

Tell me if you want the project converted to VS2019.
« Last Edit: September 09, 2020, 03:30:32 pm by Patrice Terrier »
Patrice
(Always working with the latest Windows version available...)